Chapter 2 Methodology
After a discussion regarding the definition of the phenomenon investigated and the proposal on how to frame it theoretically, the previous chapter was concluded posing two key questions intended to expose the aim of the present study. The final objective is to analyse the process of collectively creating an ‘action system’ by the individuals who are involved in the same practice, eventually assessing if, despite the possible barriers – e.g., physical distance or their belonging to a wide variety of diverse social contexts, they can be considered to have formed a ‘collective’.
The present chapter is entirely devoted to presenting the methodology adopted to empirically research this topic. Thus, in the first part of the chapter the research design will be introduced, starting by narrowing down the field of investigation, proposing a more specific and definite research question (Sect. 2.1).
Therefore, the methods and the analytical approach – afferent to SNA methodology – used in order to probe this question will be presented (Sect. 2.2).
Eventually, in the second part of the chapter, after discussing the process of data collection (Sect. 2.3), a presentation of the data is offered, providing introductory descriptive statistics and a first visualization of the network emerging from the dataset created, while introducing the analytical strategy that will be adopted in the final part of the dissertation (Sect. 2.4).
2.1 Research question
In the introduction, the argument according to which Algorave, at its minimal definition, would have been possible to be intended as a ‘collective phenomenon’ 53 has been taken as an entry point for the present discussion. This denotation lied on the fact that Algorave fundamentally consists of musicking – and thus social – events, coherent enough in terms of common characteristics to be regarded as a ‘set’ on its own.
Hence, this early interpretation has been explored in further detail within the previous chapter, questioning the presence of those characteristics in the attempt to define the boundaries of the phenomenon, eventually providing an operational definition apt to synthetise the different meanings associated to the term emerged over the years.
At the same time, as mentioned before, it has been argued that Algorave can be more effectively studied if theoretically framed as a form of collective action. Indeed, considering the involved actors’ point of view, whilst assuming a certain degree of shared motivations and intentionality within their acting collectively, it is possible to overcome the idea by which this phenomenon exists exclusively as a set of given events sharing certain variable properties, shifting the focus on how this comes into being. Or, to paraphrase Andrew Abbott,54 to investigate ‘why people construct Algorave’, conceptualizing it as single – and complex – unit at its completion, a ‘whole’, rather than ‘why people construct Algorave’, intended as no more than “a realization of a stochastic process” (Abbott, 2001: 161).
Adopting this framework, Algorave is intended as an ‘action system’ processually constructed by the individuals involved which, through this very process, form a collective.
In conclusion of Section 1.2, I suggested that the collectivity formed around Algorave phenomenon has generated from a pre-existing musicking network – which I referred to as the ‘live coding world’ – thanks to the sustained involvement and the repeated sharing of the same experience by the actors involved, resembling a type of collective formations previously identified in collective action literature – namely, ‘protest communities’ (Diani, 2009).
My thesis is that these involvement and sharing of experience has been also possible through mechanisms55 underlying, among others, the active participation to a system of social events, that eventually constitutes Algorave. I propose to understand these events as social situations – meaningful contexts in which interaction between the actors involved takes place – which have to be intended as interconnected, not because of sharing certain characteristics, but because these are the manifestation of a singular collective action: Algorave.
Thus, my aim for the present study is to investigate the mechanisms upon which, event after event, a collective actor formed within the process of construction of Algorave.
In order to do that, my proposal is to examine the system of Algorave events, specifically analysing how these are connected through the joint action of the individuals involved.
To focus on events, considered to be as the “most visible aspects of the action” (Melucci, 1996: 41), is to rely on a phenomenological perspective, while assuming “social reality [to happen] in sequences of action”, processes, “located within, constraining, or enabling structure” (Abbott, 2001: 183). In other words, “[a] matter of particular social actors, in particular social places, at particular social times” (Ibidem).
It is the aim of this study to investigate the mechanisms that, linking these social elements, favour the creation of a collective in the Algorave construction process.
2.2 Methods and analytical approach
In order to empirically investigate the question above presented, my proposal is to frame my study within the research programme based on a social network analytical (SNA) approach for the study of collective action (Diani, 2003; Diani, 2003a; Diani and McAdam, 2003; Diani and Mische, 2015; Crossley and Diani, 2019; see also Diani, 2015). In this sense, the objective is to build a research design based on the essential points suggested in the pioneering work of this approach (Diani, 2003a). These have been later remarked and integrated in light of the most recent key issues faced within the broader academic field of collective action, such as the necessity to address the online dimension of these processes (Crossley and Diani, 2019). The points can be summarized as follow:
A. Considering the exploration of duality mechanisms as a precondition to a multilevel investigation, recognizing processes of connection not only among actors and organizations, but also including events, activities, and ideas, through ad hoc analytical techniques.
B. Take into consideration the time dimension in network processes, exploring the formation and/or the evolution of networks over a period of time.
C. The inclusion in the analysis of the ‘online’ – previously referred to as virtual – dimension of these processes, investigating the multiplicity of relations occurring in both online and offline communities’ networks.
D. A specific focus on the contextual dimension, which is argued to shape collective action networks.
Applying this research design guidelines to the study of Algorave brings with it several implications.
First and foremost, with due theoretical precautions,56 adopting this network-based perspective one could intend the cluster of interactivity specifically associated to Algorave as a ‘musicking network’ (Crossley, 2020: 84-105; for empirical adoption see also Crossley, 2015). Or rather, in light of the discussion carried on in the previous chapter, as a part – a sub-network – of the “specialized musicking network” (Ibidem) which is the previously defined live coding world.
In this regard, it is important to consider the whole set of social elements which constitutes the phenomenon as interconnected, abstracting for analytical purposes “particular sets of nodes and relations from networks which are too big and complex to capture empirically” (Crossley, 2020: 87). Thus, while analytically focusing on a simplified and abstracted set of nodes and relations, it is crucial to bear in mind, at least theoretically, the complexity of the wider network in which this set is embedded, argued to be “multi-modal, multi-levelled and multiplex” (Ibidem).57
Hence, my intent is to consider not only the ties connecting individual actors involved, but rather to focus the analysis also on their connections to the Algorave events to which they actively participate (multi-modality). Moreover, I propose to study the resulting network from two different perspectives, namely from the standpoint of the individuals and from the one of the events (multi-levelness).
I confine my attention on a particular tie linking individual actors to the events, namely the performance of the firsts to the latter. The suggested perspective is to understand the performance of individual musicking actors to events as sign of their active participation to the Algorave action. While this decision is made at the expense of accounting for multiplexity, specifically focusing on this connection is here argued to provide more detailed insights for the question this study aims to investigate. In other words, it is not here questioned the importance of this aspect in the network examined, but choices have to be made when adopting an exploratory approach as in this case.
In literature, rare are the empirical research based on this approach that expressly include events within their analytical strategies. Two general tendencies can be identified among these. In the first, events are mainly handled as a source, providing the linkages among other social elements that are forming the networks then analysed – for instance, groups and issues (Bearman and Everett, 1993), or claims (Wada, 2004). Differently, a second tendency is to include events as non-agentic nodes in the networks, then analysing these latter through single-mode projections (Diani and Kousis, 2014; Diani, 2015) or three-mode network analysis (Knoke et al., 2021; see also Fararo and Doreian, 1984).
While starting from the assumption that “[r]elations in networks are about what people do in interaction” (Mische, 2003: 258), my proposal is to follow the second approach above presented, insofar as, I argue, it provides two interesting analytical possibilities. On the one hand, including events within the set of nodes forming the network improves the “topographical map” (Ibidem) of the reconstructed social structure investigated, implementing it with more in-depth insights about how it is constituted, and thus enriching the descriptive part of the analysis. On the other, it allows to grasp the “many local, contingent, and intersecting relational processes” eventually resulting in the structure investigated, favouring a shift “from primarily descriptive techniques of formal network analysis to a focus on mechanisms in social interaction” (Mische, 2003: 265, emphasis added).
Another important point for the development of a research design adopting this approach is considering the time dimension in network processes.
In this sense, a longitudinal character is intrinsic to this research, insofar as the objective is to investigate the process of construction of the Algorave ‘action system’ and the events of which I argue is constituted, during its first ten years (2012-2022). In other words, this investigation involved a reconstruction of this process temporally “[moving] from event to event”, assuming that “an event can affect only events beginning after it”, while focusing on the order of these events, and thus on the “characteristic sequences of [these] events” (Abbott, 2001: 176-177). Despite it does not represent a longitudinal approach stricto sensu, an investigation on the global view of the whole events set in the period of interest is proposed, insofar it provides further possibilities to account for the time dimension while also considering the entire history of the phenomenon, thus favouring insights regarding the sequences of events that composing it.
A more in-depth description of the set of nodes abstracted for this study will be presented in the following sections, while introducing the data and the retrieving process performed.
2.3 Data collection
In order to construct the network datasets for the empirical analysis part of the present study, I mainly relied on digital archival data as primary data, focusing first on the reconstruction of the Algorave events set. Thus, my initial approach to the retrieving process has been to collect information on all the events associated to the phenomenon.
The already mentioned Algorave website (algorave.com) has been taken as the main reference source for this process, insofar as it presents in its homepage a constantly updated, chronological, and detailed account of all the Algorave events organized so far (see Fig. 2.1).
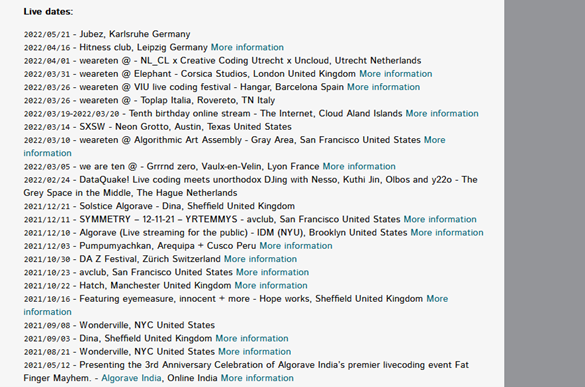
Fig. 2.1 – Detail of the list of events in the Algorave website’s homepage (Screenshot: 22/04/2022)
While of considerable value for providing a complete list of which events should have been included in the dataset, the website presents only few information regarding the events – a date, a location, and only occasionally the name of the organizers or the performers. Nevertheless, the large majority of the entries in the list are accompanied by a link to external web sources – e.g., Facebook events, where additional data have been possible to be retrieved.58
Considering that the first events date back to ten years ago (2012), one complication for the retrieving process was dictated by the fact that some of the domains to which the links referred were expired, and thus inaccessible. To overcome this, I relied on the online tool “Wayback Machine”,59 created by the non-profit organization Internet Archive, which provided me with the possibility to having access to these Internet sites and retrieved the needed data.
Methodologically, possible reliability and validity issues60 emerging in the use of archival sources (Borgatti et al., 2018: 65) have been considered and a constant process of verification on the data collected has been operated.
The data collected have been then systematically organized in a dataset – the “Algorave Event Dataset” – aimed at providing the basis for subsequent creation of the specific network datasets for the analysis.
At first, a list of the events have been compiled, retrieving information with regards to when (‘Year’; ‘Date’) and where (‘City’; ‘Country’) they took place, about specific characteristics of the events (‘Venue Type’; ‘Entrance Fee’), and three additional dichotomic attributes of the events, considered to possibly providing further insights on the phenomenon investigated: namely, if a university was involved in the promotion and/or organization (‘University’); if the event was part of a larger festival (‘Festival’); whether side activities – such as workshops – were organized during the event (‘Side Activities’); and, eventually, if the organization of the event received some kind of support by institutions – e.g., providing infrastructure or economical support, such as funds (‘Institutional Support’).
Moreover, besides the construction of the events’ dataset, I created a document in which textual data on the events have been collected, including for instance excerpts of blog or newspaper articles regarding the events as well as self-description provided by the organizers, in order to enrich the data collected with other insights useful for the late interpretation phase.
Therefore, considering the specific aspect of Algorave collective action this study is aimed to research, data on the performing actors – both musicians and visualists – have been included in the dataset for each Algorave event.
Insofar the initial aim was to apply a 3-mode network analytical strategy and considering another aspect of Algorave collective action (organizing the events ), at first the data collection process followed this direction, including also data regarding collective formation (e.g., bands) and on the organizing actors – both individual and collective.
Nevertheless, considering the effort and investment in terms of time,61 I eventually opted to follow this collection strategy only for the events organized in the first five years of the phenomenon, interrupting the retrieving process at the ninety-first event – which coincides with the fifth anniversary of the organisation of the first Algorave event.
Despite its incompleteness, the set of events considered still results of interest for this research insofar as it represents a particular phase, namely the initial one, of the Algorave phenomenon development.62
In the second phase of this process, data have been elaborated in order to make them usable for network-based analytical purposes. Therefore, a matrix including the connections among single actors and the event(s) at which they performed has been created, resulting in a 2-mode relational dataset.63
At the same time, the above mentioned data collected on the events (Location at country-level; Venue Type; Involvement of University; Event as part of a Festival; Organisation of Side Activities; and Institutional Support) have been systematised as attributes of the nodes related to this mode.
In the following section the 2-mode network connecting the performers to the events is presented, along with descriptive statistics to introduce it, while contextualizing within the history of the phenomenon so far the events considered, and the first visualization of the resulting graph.
2.4 The Algorave Event-Performer Network (AEP)
Before proceeding with the presentation of the bimodal network formed by the performers and the events, it is considered appropriate to first provide an overview of the sample composed by the latter, so as to place them in context within the evolutionary trajectory of the phenomenon so far.
In Figure 2.2 (Fig. 2.2), a graph of the trend of Algorave events over its first ten years (2012-2022) is presented. I divided in ten periods of the duration of a year the time frame in which Algorave phenomenon developed so far, starting from the date of the first Algorave event, organized on March 17th, 2012. So each period, expressed in Roman numerals, goes from the 17th of March to the 16th of March of the following year – e.g., period I goes from 17/03/2012 to 16/03/2013, period II from 17/03/2013 to 16/03/2014, etc. – with the exception of period V, which counts one day more, in order to include the event organised for the Algorave 5th birthday (17/03/2017).
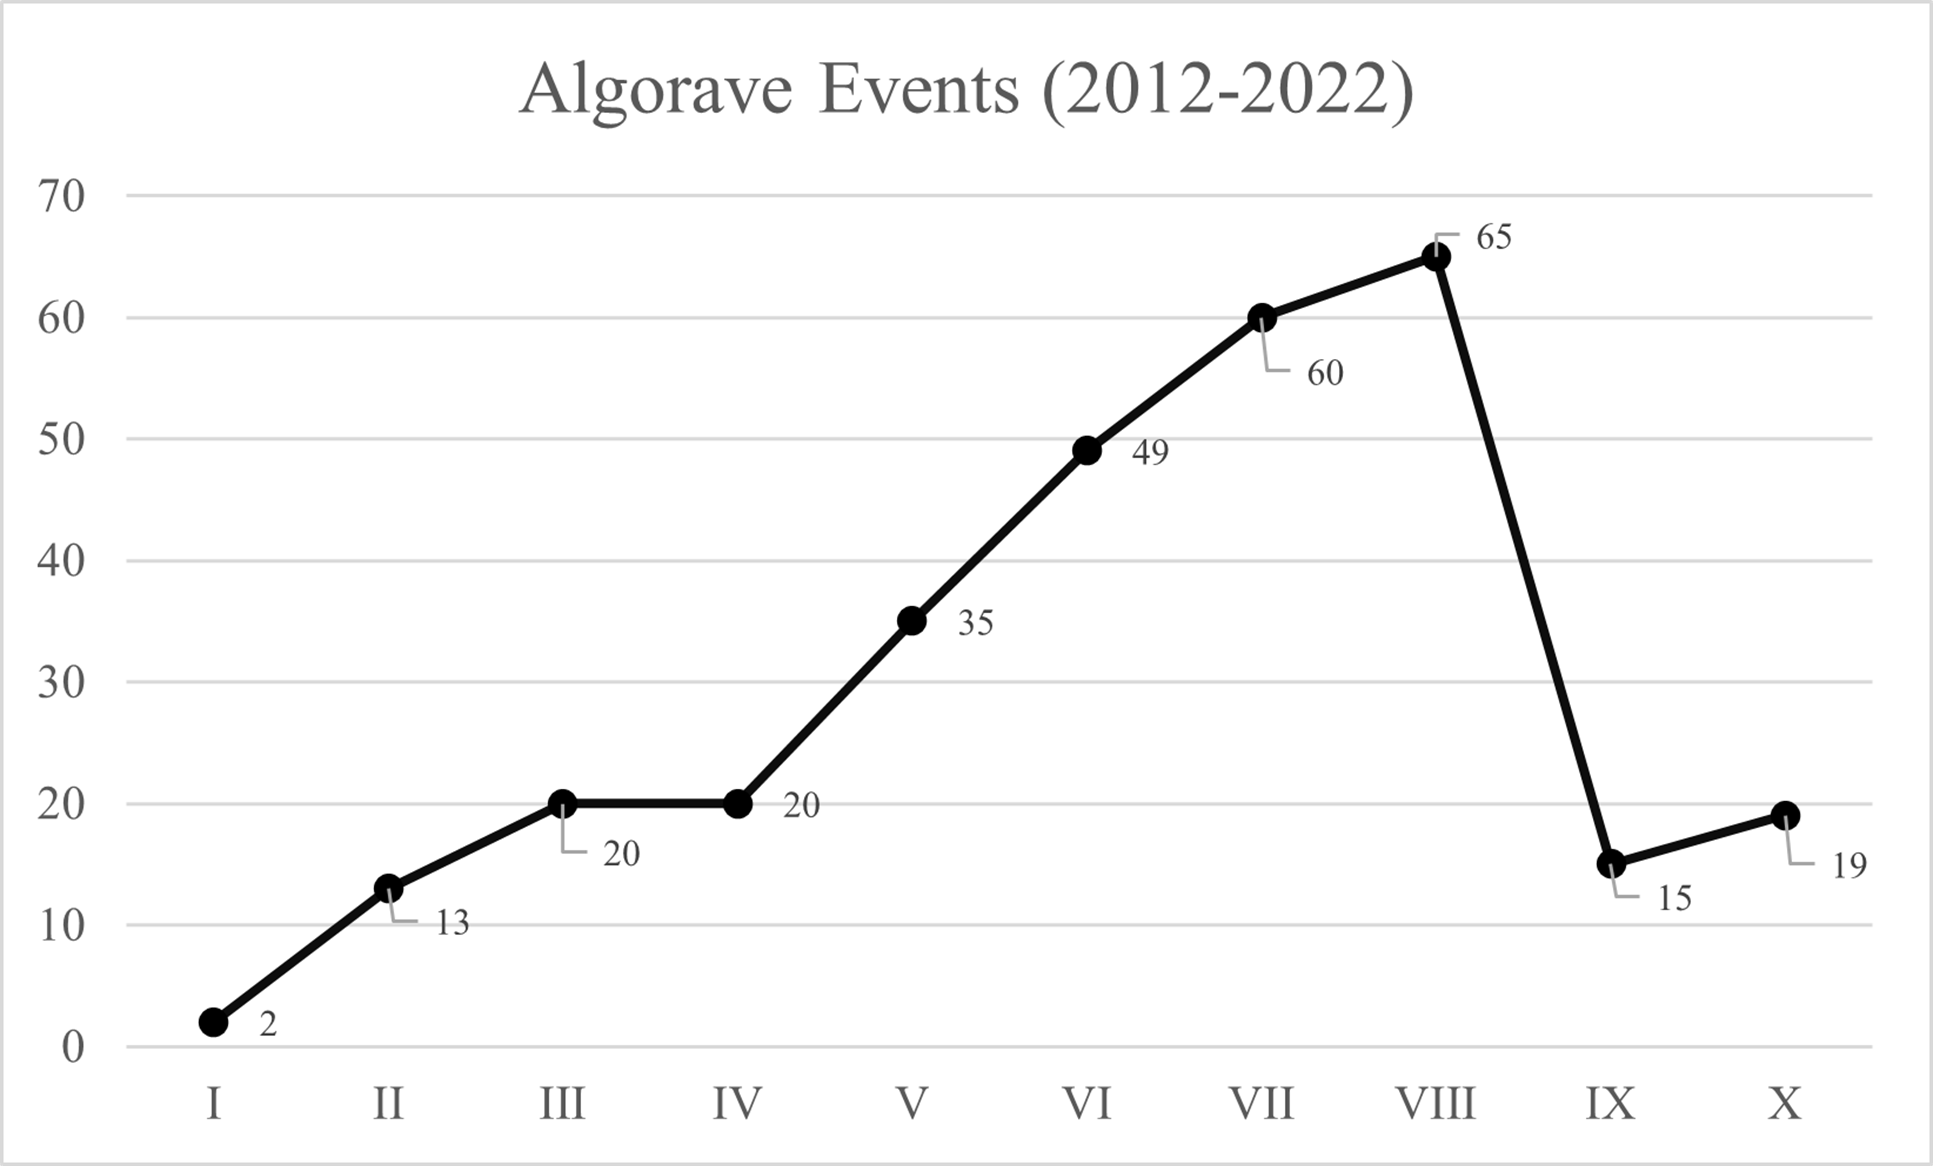
Fig. 2.2 – Number of Algorave events organized per period (2012-2022)
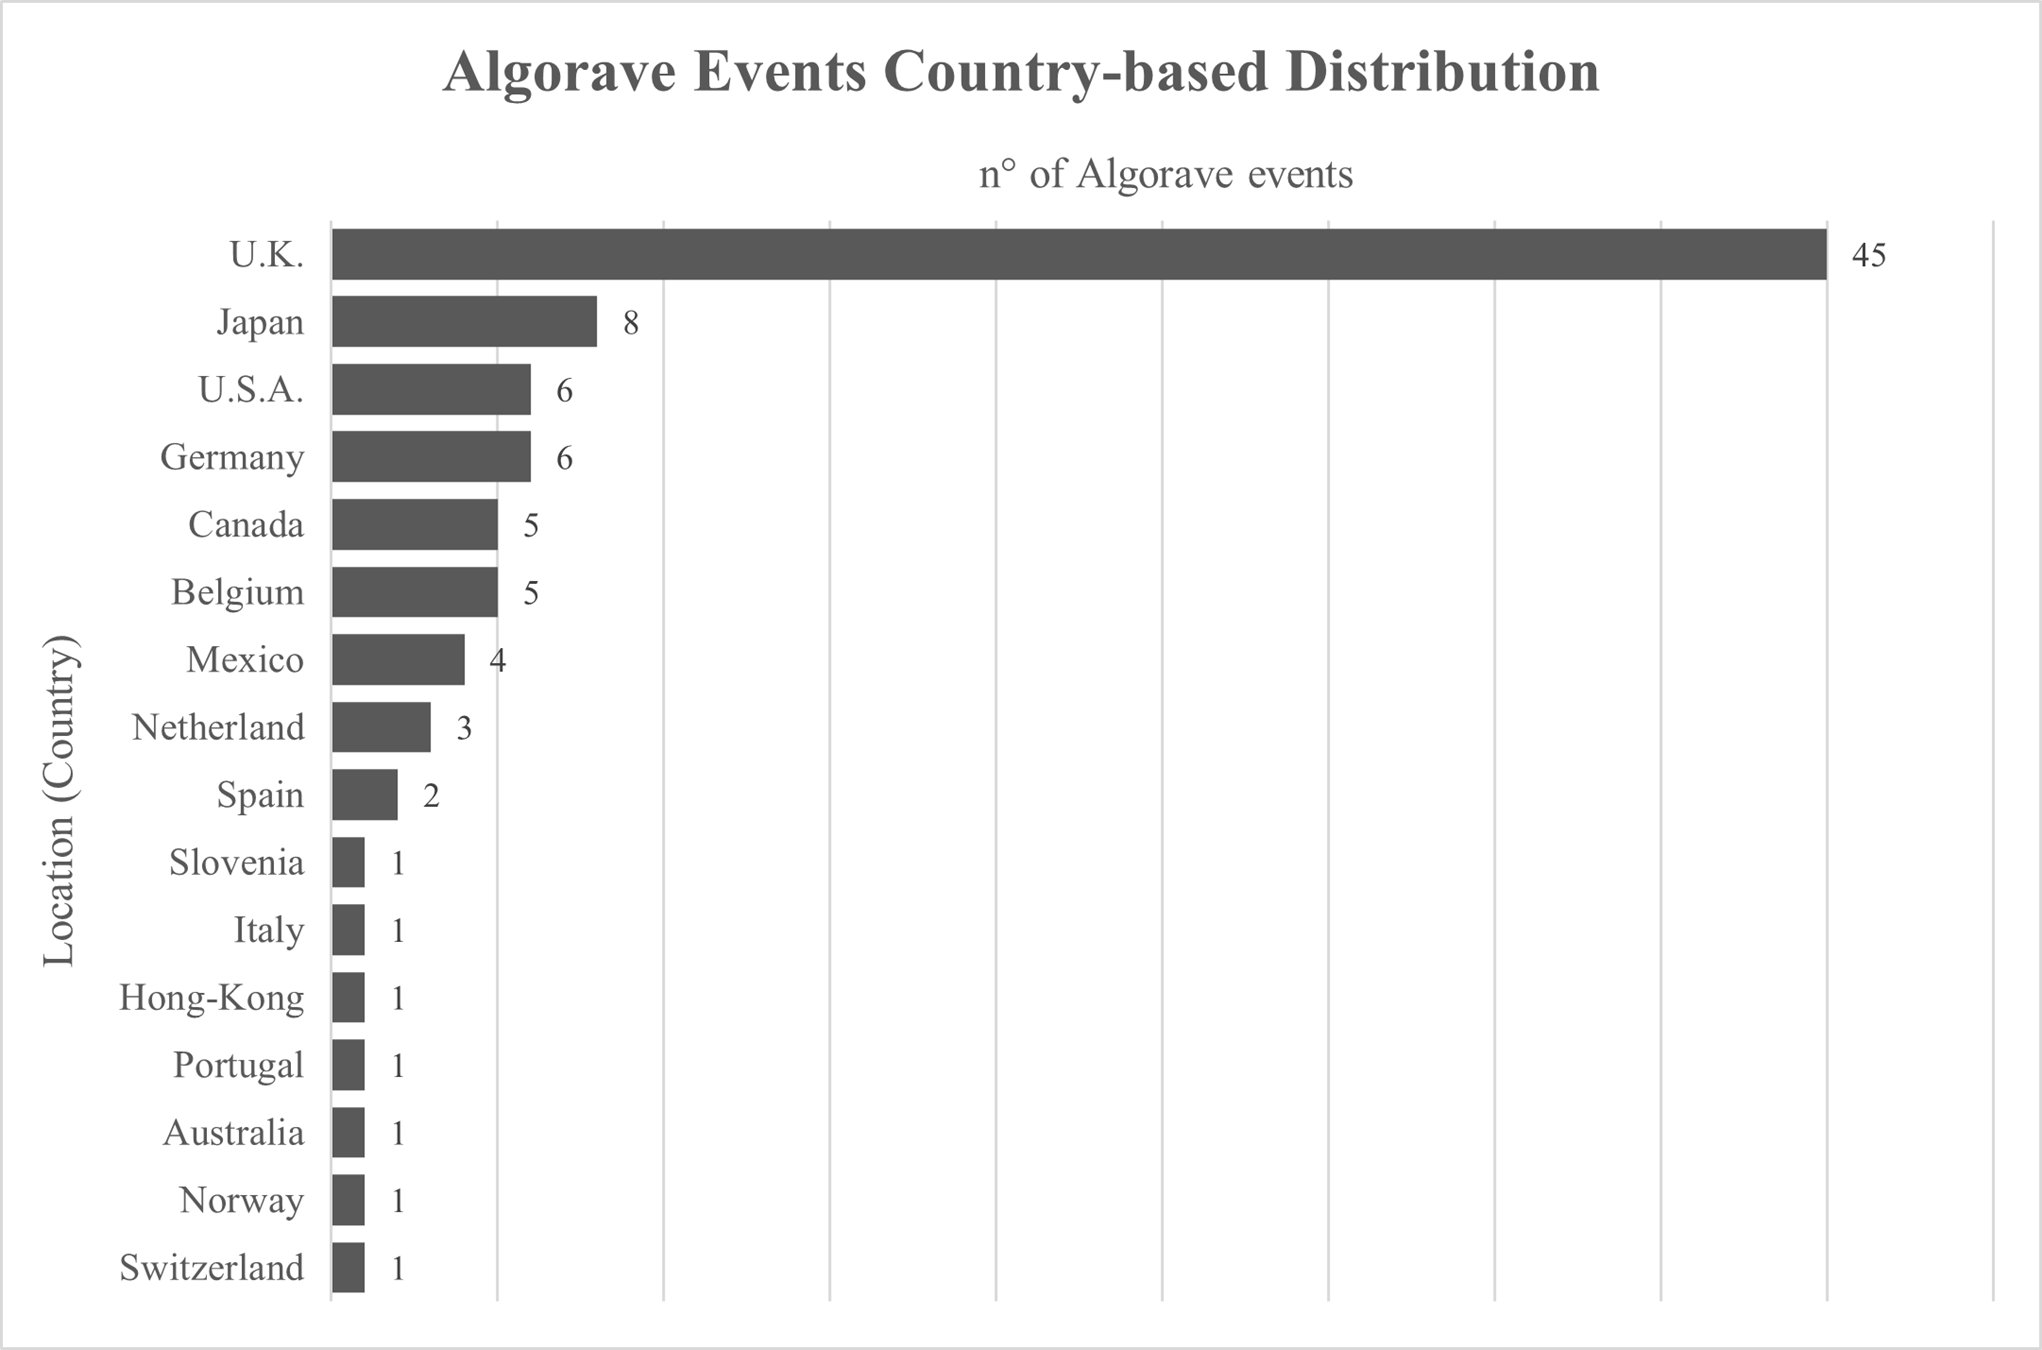
Fig. 2.3 – Country-based distribution of Algorave events (period I to V, N = 91)
From this aggregative view of the phenomenon, it is possible to clearly notice the emergence of a wave, shaped by a sustained increase in terms of number of events organized, up to a maximum of 65 events in period VIII, followed by a significant drop (-50 events) in concomitance to period IX (2020-21).
As mentioned before, for the present study only the events belonging to the first five periods (I-V) will be considered, thus focusing the attention on the initial expansion of the phenomenon, characterised by the growth of the number of Algorave events in the periods I to III, its transitory settling phase of stability in the biennial III-IV, and the first part of its incremental phase (period V) that eventually led to the peak of expansion witnessed in the years that followed.
The sample counts a total number of 91 Algorave events organised in the period considered, which will be the nodes for the event mode in the bimodal network.
Further insights with regard to the events considered are provided by introductory descriptive analysis on the basis of the attributes associated to these nodes.
Figure 2.3 (Fig. 2.3) presents the relative distribution of the events for each of the country in which at least one of these has been organised. From a general perspective, in its first five years Algorave action spread in 16 different countries, at least one for each of the four continents, among which Europe is the most represented (10 countries over 16).
An interesting datum is represented by the share of Algorave events organised in the United Kingdom in this first phase. Indeed, almost half of these took place in the country (45 over a total of 91), suggesting the characterisation of Algorave action as mainly developing in the British context – at least in its initial phase. Despite this interpretation is quite intuitive, as Algorave was actually born in England, it is still noteworthy to consider the relatively rapid spread of the phenomenon in other countries. While in the first period (I) the only two events organised took place in England, respectively in the cities of London and Birmingham, six more countries have been reached in period II (in order of appearance: Germany, Australia, Canada, Slovenia, Spain, Japan), to which five more are added in the following period (Netherland, Belgium, Mexico, Portugal, and Switzerland). Moreover, during the transition between the third and the fourth period (III-IV), previously referred to as ‘settling phase’, only one additional country has been reached, namely United States – with the Algorave organised in Santa Barbara (CA). Eventually, in the last period considered (V), Algorave events have been organised in three more countries for the first time (Hong-Kong, Italy, and Norway), resuming the sustained growth that accompanied the following stages of the phenomenon. In this sense, it is also remarkable to report that the last period (V) is also the most diversified in geographical terms, as at least one Algorave event was organised in 11 different countries,64 evidencing the now settled global dimension of the phenomenon.
Table 2 (Tab. 2) summarises the other attributes characterising Algorave events in the sample.
Firstly, are presented the frequency distributions of the attribute ‘Venue Type’, addressing the physical locations in which the events took place. Nine are the categories65 emerged from the data collection process regarding this characteristic: ‘Collective Spaces’ – here in the sense of non-institutional places run at grassroot level by individuals affiliated to local communities (e.g., squats, as well as voluntary-work based arts sites); venues specifically used for live music (‘Music Venues’), distinguished to public houses and cafeterias where music is played (‘Café/Pub’) and nightclubs (‘Clubs’); venues for the arts in general (‘Arts Venues’), including museums of contemporary art, theatres, and artist retreat centres.
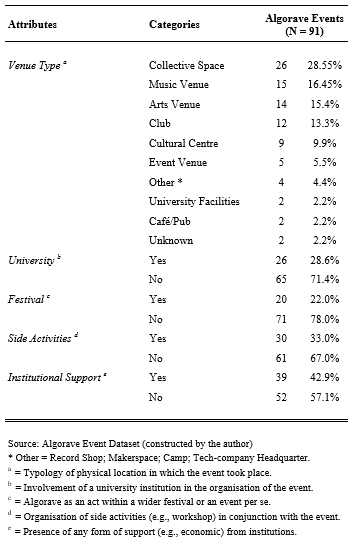
Tab. 2 – Algorave events characteristics
In addition to the above, there are those usually rented for public events, such as conferences or public meetings (‘Event Venues’), and the ‘Cultural Centres’ – similar to the firsts, but characterised by involvement of institutions; structures of property of a University (‘University Facilities’). Finally, a category (‘Others’) for all the peculiar cases which do not fall into the previous – namely record shop, makerspace, camp, tech-company headquarter – has been created.
As emerging by the results of the frequency distributions for this attribute (see Tab. 2), meaningfully the majority of Algorave events have been organised in collective spaces (28.55%), rather than in other more institutionalised types of venue. The other spots where these events took place the most are Music Venue, Arts Venue, and Clubs, each having a share of around 15% over the total of the events organised.
Despite in the discussion previously carried on an indicative link between Algorave phenomenon and the academic field emerged, only the 28.6% of the events present a University as an actor more or less directly involved in the organisation, and only 2 events took place in University facilities. Nevertheless, these data may be still considered significant bearing in mind that Algorave is a music-based phenomenon, even more so as associated to a culture, namely the rave one, traditionally quite distant from the academic world if not as an object of study.
Twenty Algorave events (22%) have been performed as acts within wider music festivals all over the world, sometimes specifically related to live coding practice (e.g., the ‘live.code.fest’ 2013 in Karlsruhe, Germany, or the ‘Network Music Festivals’ in Birmingham, U.K., organised in 2013 and 2014), sometimes associated to related topics, such as the relationship between art and media or technology (e.g., the ‘Electromagnetic Field’ in U.K., or the ‘Transmediale Festival’ in Berlin, Germany), others in festivals already affirmed both at local and international level (e.g., the ‘Allcaps Festival’ in Toronto, Canada, or the ‘Earzoom Sonic Festival’ in Ljubljana, Slovenia).
Moreover, often – one third of the times (33%) – the events are accompanied by side activities, such as workshops or roundtables on live coding and Algorave, suggesting a specific effort by the promoting actors to spread their vision and understanding of the practice.
Eventually, it is important to notice that the share of events which have benefited from institutional support in their organisation is close to the one which have not (respectively 42.9% and 57.1%). This balanced proportion is particularly interesting in the light of a distinct passage from the discourse previously carried on, where it was pointed out that institutional support – although not repudiated – should be treated with caution in the organisation of the events, as Algorave is argued to be based on the principles of free culture.66
Now that an overview of how the events are characterised has been provided, it is finally possible to take a look at how they connect with the performers, considering the bipartite network. In next page, the visualisation of the 2-mode ‘Algorave Event-Performer’ (AEP) graph is presented.
The AEP is composed of 367 nodes in total, respectively 91 belonging to the event mode and 276 to the performer one. These nodes are connected by a total of 692 edges, signifying the performer’s participation to an Algorave event.
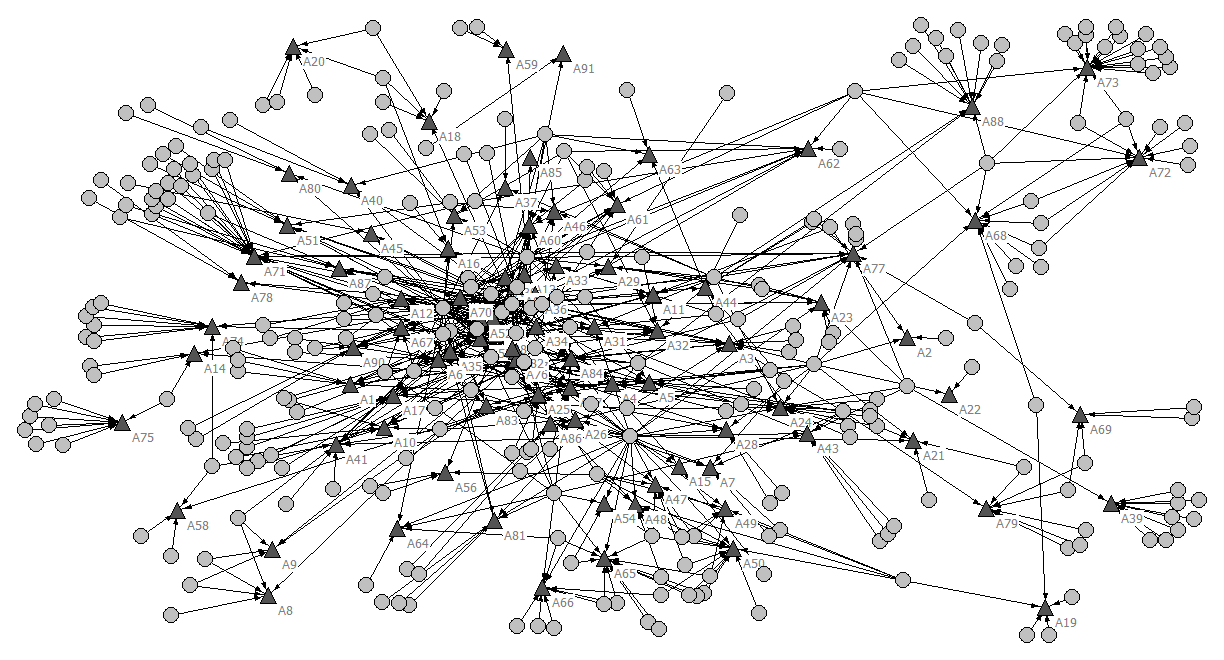
Fig. 2.4 - Algorave Event-Performer Network (2-mode directed network - ties = actors (circles) performing to events (triangles); Ne = 91; Np = 276)
As bipartite network, only inter-modal connections have been considered in the construction of the network dataset. Moreover, since the performers (agentic nodes) participate to events (non-agentic nodes), but these last are not intended to be ‘participated’ to the firsts, the edges are to be considered unidirectional. The acceptance of this basic assumption underlies the decision to intend the graph as directed.67
One first basic measure to describe a network structure is density, commonly aimed at providing an initial overview of how much the nodes are connected among each other. As standard procedure, the value of the total number of ties present in the network is normalized on the basis of the maximum number of possible ties which could connect all the present nodes n(n-1), where density equal to 1 means that all the nodes are connected among each other. Nevertheless, as pointed out by Stephen Borgatti and Martin Everett in their article on the analysis of 2-mode networks, “the standard denominators are clearly not appropriate for […] 2-mode data, since no ties are possible within vertex sets”, and thus “[t]he maximum number of ties possible occurs when every vertex in one set is connected to every vertex in the other” (Borgatti and Everett, 1997: 253).
Therefore, in this case, the total number of ties connecting the nodes of these two sets (692) is divided by the result of the product between the total number of performer nodes and the one of event nodes (276 ∙ 91 = 25116), resulting in a density level of 0.027.
As expectable this network is characterised by a low density level, as it would have been otherwise surprising to discover that a phenomenon constituted by this number of events, organised in a total of sixteen different countries over a five-year period, to which almost three hundred performers participated, would have been characterised by higher levels of connectivity among nodes of different sets – which is to say that most of the performers would have participated to all the events organised.
A useful measure at the node level to quantify the participation at the events by the performers is degree centrality. This standard is computed by simply summing the edges for each node present in the sets. Its interpretation, despite the bi-modality characterisation of the network, is quite straightforward, as the degree of a performer represents the number of events (s)he actively participated to, and the degree of an Algorave event is the number of performers who attended it.
Nevertheless, when normalising the scores of this measure – as suggested by Linton C. Freeman (1979), its first developer for single-mode networks – and thus relativising the value to the maximum one theoretically possible, caution is once more needed. Indeed, if for single-mode network the count of the edges for a particular node is normalised dividing it by (n-1), for bi-modal cases “the maximum degree of a node is given by the number of nodes in the opposing set” (Borgatti and Everett, 1997: 254).68
Since the AEP graph has been represented as directed, though, the degree centrality scores for each mode are to be considered respectively a measure of in-degree centrality – for the performer mode – and out-degree centrality – for the event mode. The results of the computation are presented in the following tables, where are included only the first ten performers (Tab.3) and events (Tab.4) with the highest score for each relative measure.
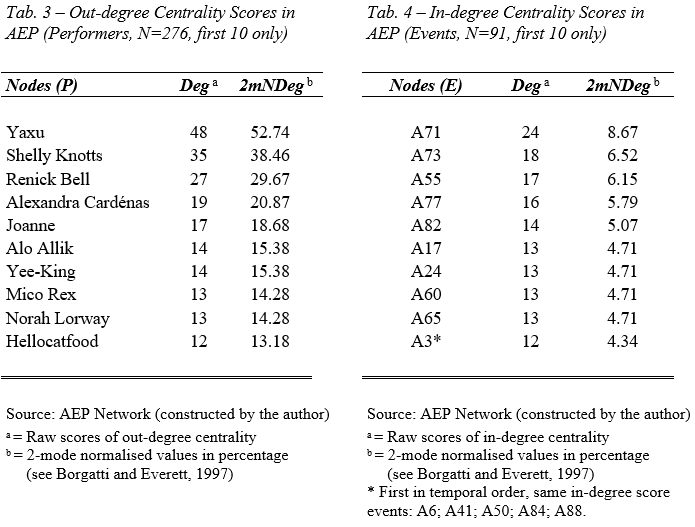
From the performers’ perspective, some nodes are clearly emerging as more central than others. The most central node in this set, meaning the performer who took part at the most events, is Yaxu – moniker of Alex McLean, one of the co-founders of Algorave – performing to more than the half of the total events organised (52.74%, with a participation to 48 events over a total of 91). Shelly Knotts, an artist-researcher based in Newcastle Upon Tyne (U.K.), followed with a total participation to over one third of the events (38,46% – 35 events).
On the other hand, from an event-based standpoint, from the second table presented (Tab. 4), it is possible to notice how the events which involves the higher numbers of performers are the Algorave organised as part of the 2016 ‘Electromagnetic Field’ Festival (A71), where a total of 24 performers actively participated, the ‘Algorave Transpiksel’ (A73) event in Mexico City organised a month later, which involved a total of 18 performers among musicians and visual artists, and the ‘Algorave London #2’ (A55) – despite its name, the seventh organised in the city – with 17 performers.
In conclusion to this introductory descriptive analysis, it is interesting to bring the attention to the fact that the most attended fifteen Algorave events involved a minimum of 12 performers each, a datum not to be taken for granted considering the fact that these are musicking events.
Further considerations are leaved for the next chapter, expressly devoted to the in-depth analysis of the network here presented. In order to particularly focus the attention on the two aspects of interest emerging from the research question – the construction of an event system, and the parallel process of collective actor formation – a single-mode projection analytical strategy will be adopted. This is a common analytical strategy to inquire bipartite networks, consisting in the creation of “a new dataset in which a pair of actors is said to be tied to the extent that they share affiliations” (Borgatti at al., 2018: 269). Despite in the past this strategy attracted criticism in the literature – mainly based on the assumption that adopting this method would resulted in loss of data, more recently these accounts have been questioned as overemphasised (Everett and Borgatti, 2013).
Considering the highly specific type of events here analysed, as well as the ties that links individuals to these – to perform, or to actively participate, not only attending – I argue to be possible interpreting the results of this kind of analysis as signifying distinct interactions among the actors involved which are said to having favoured, when repeated in time, the construction of the Algorave action system.
Moreover, insofar the aim is to examine the resulting structure of each of the modes characterising the AEP network, this analytical strategy is particularly appropriated since it provides a global view for each aspect based on its relation with the other, allowing to focus the analytical attention on one aspect at the time.
Thus, in the first part of the analysis, the network analysed will be derived by the AEP network considering the events connected as having at least one performer in common. On the contrary, in the second, will be presented the graph that includes the ties among performers who share their participation to at least one of the events.
All the analysis in this study, including the construction of the relational dataset and the operations of single-mode projection on the dataset, have been performed using the UCINET software (Borgatti, Everett, and Freeman, 2002), while the visualization of the networks presented in the figures with the related software NetDraw (Borgatti, 2002).
To recall the definition adopted: “collective phenomena are those sets of social events that comprise a number of individuals or groups exhibiting, at the same time and in the same place, behaviours with relatively similar morphological characteristics” (Melucci, 1996: 20).↩︎
Originally, Abbott refers to “having certain careers” as the “empirical referent for [his] otherwise abstract discussion” (2001: 161-4).↩︎
See Gross, 2009.↩︎
As, theoretically speaking, Crossley’s (2015; 2020) elaboration of the concept is mainly oriented to the study of ‘music worlds’, nested in a wider ‘music universe’, based on the understanding of ‘collective action’ provided by Becker (1974, 1982), already questioned in the discussion presented in Section 1.3.↩︎
“[M]ulti-modal [as] musicking networks involve many different types of nodes. Human actors – playing a variety of […] roles – are crucial, but they connect to corporate actors, […]; to events of various kinds […]; and to objects such as […] technologies. […] By multi-levelled I mean to capture the way in which sub-networks nest within one another. […] We observe relations between audience members; between gigs; and between audience members and gigs. Connections exist on different levels, within and between different sets of nodes. By multiplex I mean that any two nodes might be tied in many different ways. Two musicians might be both bandmates and friends, for example, and might take on a variety of roles in relation to one another at different times” (Crossley, 2020: 87-88).↩︎
In those cases in which no link associated to the event was present, the few information present – a locality and a year – have been sufficient keywords for ad hoc web research, from which other links associated to the event emerged, providing additional sources for data collection.↩︎
The validity of data is threatened by several types of errors, among which ‘omission’ or ‘commission’ errors, wrong attribution of edges and nodes, and the ones related to retrospective dimension of data collection (Borgatti et al., 2018: 44).↩︎
Indeed, the 3-mode network research strategy has been elsewhere recognized to be “complex” as “[i]t requires considerable investment and energy to build a proper dataset that adequately covers these three levels” (Knoke et al., 2021: 137).↩︎
Further elaboration in the next section, in particular see Fig. 2.2.↩︎
See Borgatti and Everett (1997).↩︎
While in the previous periods the maximum of countries reached in a year was 7 (periods II and III, followed by period IV with 6 countries) and a minimum of, as already mentioned, a single one (U.K.) in period I.↩︎
Excluding the one, ‘Unknown’, related to missing data.↩︎
See Appendix A and Section 1.1 for the related discussion. The aspect of the institutional support represents an important insight upon which further specific research is considered to be deemed needed. Nevertheless, in the present study it is treated exclusively as an attribute, insofar an ad hoc data collection more focused on this aspect would have been necessary to be implemented – for instance retrieving crucial information on which are the institutions involved, how the Algorave participants connects with them, as well as regarding the specifc forms of support provided for the organisation of events related to the phenomenon.↩︎
Otherwise, accepting the events to be intended as ‘being participated’, it would have been also possible to consider the AEP network as undirected, as all the present ties would have been reciprocal – accordingly to the logic by which if a performer participate to an event, necessarily this event is also participated to the performer in question. Despite commonly 2-mode graphs are intended as undirected (Borgatti et al., 2018), to point out the agency-based distinction between these two modes in the representation, it has been opted otherwise to understand the AEP as a directed network.↩︎
Note that “[t]he only way that a node in a bipartite graph can achieve maximum degree in Freeman’s terms is the case where one vertex set contains just one node and the other set contains all other nodes”, and for this reason “the normalized scores would not be a linear transformation of the raw scores, unlike the Freeman normalization”, even if this “not necessarily” represents “a disadvantage […] since […] after all considering different entities” are considered (Borgatti and Everett, 1997: 254).↩︎